Handwriting Transcription of a fieldbook with Microsoft’s Azure Cognitive Services, Amazon’s AWS Textract and GCP.

The Computational Creativity and Archaeological Data project is working with the Antioch fieldbooks from the 1930’s. These fieldbooks have been scanned and are available for research here. This post will discuss the automated transcription of one of these fieldbooks.

Handwriting transcription is relatively new, but is mainstream and works well. For example, see Simon Willison’s blog. The Antioch fieldbooks offer an additional challenge for transcription, they are written in pencil which does not contrast well with the background color of paper. See the image below:

Clarence Fisher et al., “OCHRE Publications—CIAO,” The Excavation of Antioch-on-the-Orontes, accessed August 26, 2022, https://ochre.lib.uchicago.edu/ochre?uuid=592262bf-ded9-442a-a6a8-150b0da86ca5.

At first, when I used Azure Cognitive Services to transcribe text, the results were rather poor, as per below:

1 Juin.
C'st un terrain situe a l' Est on la Renti ; inst contyn
Le pek voyia à & maism ro'sine a fm muriau
À la rent , pos ihr con Na Ih tivain - Jun 10m x3m

I rendered the images into black and white to increase the contrast. (Working code is here.) Below is a sample image and results.
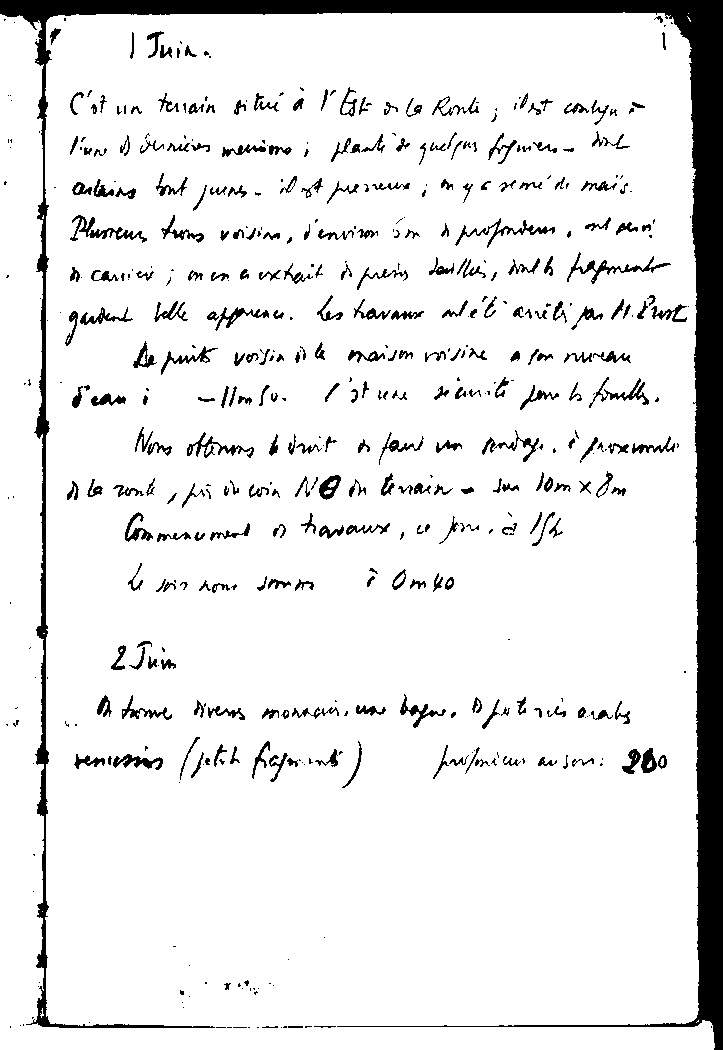
Fieldbook page ANT_FB_1932-003-0000 rendered as black and white.
1 Juin.
C'est un terrain situé à l'Est or la Route ; il est conlyn
l'un 1 derrières massimo ; plante de quelpas figuiers - dal
acting but jeers . it off presseurs ; in ya reme'de mai's.
Plusieurs tuns voision, d'environ 5m de profondeur, as servi
À carrier ; men a extrait is press dailles, with fragment
gardent belle apparence. Les travaux net avéli pas 11. Pust
De puits voisin A la maison voisine . for nouveau
Sean : - 11mbo . I st use seemite love to fouls .
None offirms & droit as faul un povagy, è prosimale
À la conte , pi du coin NO in terrain - sun 10m xIm
Commencement 1 travaux, 4 por, à Ifhe
, Om40
2. Jun
A frame Divers monacies , une bagno . A foto ries orals
4.
remission ( patch fragments) profmeus au son : 200

As shown above, the results are better. I’d like to fine tune the image contrast process to improve results though.

Although the results improved, they are not that useful. I tried AWS Textract to improve results. For this page, here they are:

 ) Juin. C'st uin tanain situi a 1 Est is la Ronte ilst conlyn 1. Fun & burious menime; plants & guelpus togmen me anthoms but jurns it it preneure m y c remi'd mais Plusen two valian, jenvisor 5m A proformance and phri n carrier; men a extail is prems dailler, inth hagment gardent little appenence. he havane mit anition 11 Part L puils verying 1 a maison misine . for mean iean i - - limsu. / it use viamits from h fomells. Nons oftension i init to fani in andry. iproxemate 1 la wonte, , tris it win NO in train - in 10mx cm Commenument 1) havause, " pone. ' 15th le this home Jmm i Om40 2Jum time Avens moraan.un before. D fut in each renisms (ptob pro/mium wuson 260 ) Juin. C'st uin tanain situi a 1 Est is la Ronte ilst conlyn 1. Fun & burious menime; plants & guelpus togmen me anthoms but jurns it it preneure m y c remi'd mais Plusen two valian, jenvisor 5m A proformance and phri n carrier; men a extail is prems dailler, inth hagment gardent little appenence. he havane mit anition 11 Part L puils verying 1 a maison misine . for mean iean i - - limsu. / it use viamits from h fomells. Nons oftension i init to fani in andry. iproxemate 1 la wonte, , tris it win NO in train - in 10mx cm Commenument 1) havause, " pone. ' 15th le this home Jmm i Om40 2Jum time Avens moraan.un before. D fut in each renisms (ptob pro/mium wuson 260

AWS Textract translates more letters, but based on this one page, Azure Cognitive Services seems to better understand the French language text. AWS supports French, but I am not sure if there is a parameter to tell it to use French, like Azure Cognitive Services uses. Below is a program line for Azure Cognitive Services setting language = “fr”.

read_response = computervision_client.read(read_image_url,  raw=True, model_version="2022-01-30-preview", language = "fr")

I also tried Google Cloud Platform (GCP). (I wrote about using GCP here.) GCP also supports French with “language_hints”:

    image = vision.Image(content=content)
    response = client.text_detection(
    image=image,
    image_context={"language_hints": ["fr"]},  
     )

Below are the results for the page above:

-1 | Juina C'st un terrain situé à l'Est or La Ronti ; il est conly n l'une if Juniores mecione ; plante de quelqus figniers dink orting bout joins il y preveux ; yo semé de mais . Plusieur tous voisina , d'environ 5on à profondeus , ont pris ! gardend à carrier ; men a extrait is presies desitlers , wind to fragmento belle apparence . Les travaux atét anéli par 11. Pust te punts voisin is la maison voisine a for mureau -11m Su- / sture sécurité pour to fouilles . anday presente Nons oftenons uit os fami de la conte , fis in coin NO in terrain - fon 10m x 8m Commencement of travaux , ce jour , an Ist > Omko de Join home from 2. Jum tarme Divers monnaies , un reniesios ( jetch faforint ) m * bojne foteries orals . proponicur ausen : 200 

Here are some additional results for you to judge: see this page and click the “next” link to browse further. This spreadsheet lists the pages and transcribed text in the “contrasted_pages” tab.
Forest Cover of Pennsylvania

Our project to detect relict charcoal hearths (RCHs) relies on using LiDAR data that shows the what remains of these hearths on the surface of the land. These hearths were constructed in forested areas near the trees that were felled to build them. As forests regrew, remains of RCHs were often preserved. The distinctive flat, 10-15m circular areas are visible in slope images derived from LiDAR data. Not all of these objects in forested areas are RCHs, but in Pennsylvania, many are. The density of RCHs in parts of the state is due to the extent of historical charcoal making to fuel the early steel industry. This was before steel making transitioned to using mineral coal starting in the mid-nineteenth century and completing in 1945.

In non-forested areas it is much less likely that similar looking objects are RCHs. The surfaces of non-forested areas today are more likely to be disturbed by development or agriculture since the era of charcoal making. Thus, any evidence of an RCH, even if once present, is likely to have been plowed or bulldozed over.

Given this premise, when detecting RCH it is more efficient to spend effort only on searching forested areas. At the same time, by ignoring detected objects that look like RCHs in non-forested areas, high likelihood false positive RCH detections can be removed from consideration. For these reasons, I wanted to have a vector layer of forested areas of Pennsylvania. Creating the vector layer takes several steps, described below.

PAMAP Program Land Cover for Pennsylvania, 2005

I based the forest vector layer on the PAMAP Program Land Cover for Pennsylvania, 2005. https://www.pasda.psu.edu/uci/DataSummary.aspx?dataset=1100. This is a detailed, large file size raster that describes the land cover of the state. Due to the detail, converting this entire raster file into polygons of a vector file consumed too many resources for QGIS to complete this on my machine. To solve that problem, I clipped the dataset into a smaller geographic area and then filtered the results to just forest land cover.

Clip by extent

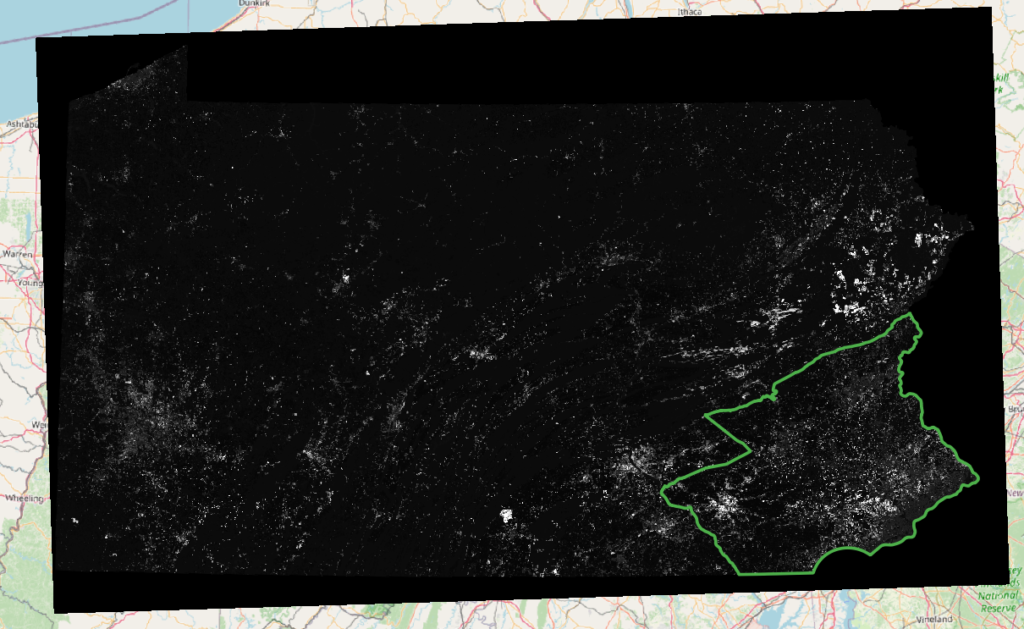
Our project is conducting a search of RCHs in the entire state of Pennsylvania. To break the project down into smaller steps, the project searches the state by Forest District. Presently, we are searching Forest District 17 in the south east part of the state. Below is a screen shot of the land cover raster in gray scale and Forest District 17 outlined in green. The Forest District file is filtered on “DistrictNu” = 17 in QGIS.

QGIS showing land cover raster in gray scale with Forest District 17 outlined in green.

Below is the detail of the QGIS command used to clip the raster. In QGIS’s menu it is: Raster | Extraction | Clip Raster by Mask Layer…

Input layer: ‘E:/a_new_orgs/carleton/pennsylvania_michaux/land_cover/palulc_05_utm18_nad83/palulc_05.tif’

Mask layer: ‘E:/a_new_orgs/carleton/pennsylvania_michaux/DCNR_BOF_Bndry_SFM201703/DCNR_BOF_Bndry_SFM201703.shp|subset=\”DistrictNu\” = 17’

Algorithm 'Clip raster by mask layer' starting…
Input parameters:
{ 'ALPHA_BAND' : False, 'CROP_TO_CUTLINE' : True, 'DATA_TYPE' : 0, 'EXTRA' : '', 'INPUT' : 'E:/a_new_orgs/carleton/pennsylvania_michaux/land_cover/palulc_05_utm18_nad83/palulc_05.tif', 'KEEP_RESOLUTION' : False, 'MASK' : 'E:/a_new_orgs/carleton/pennsylvania_michaux/DCNR_BOF_Bndry_SFM201703/DCNR_BOF_Bndry_SFM201703.shp|subset=\"DistrictNu\" = 17', 'MULTITHREADING' : False, 'NODATA' : None, 'OPTIONS' : '', 'OUTPUT' : 'TEMPORARY_OUTPUT', 'SET_RESOLUTION' : False, 'SOURCE_CRS' : QgsCoordinateReferenceSystem('EPSG:26918'), 'TARGET_CRS' : None, 'X_RESOLUTION' : None, 'Y_RESOLUTION' : None }

GDAL command:
gdalwarp -s_srs EPSG:26918 -of GTiff -cutline C:/Users/User/AppData/Local/Temp/processing_gEEUVX/081df2395865469b973df34e0f45f1e5/MASK.shp -cl MASK -crop_to_cutline E:\a_new_orgs\carleton\pennsylvania_michaux\land_cover\palulc_05_utm18_nad83\palulc_05.tif C:/Users/User/AppData/Local/Temp/processing_gEEUVX/899b60ac78354e019d9c2a2992ae4905/OUTPUT.tif
GDAL command output:
Copying raster attribute table from E:\a_new_orgs\carleton\pennsylvania_michaux\land_cover\palulc_05_utm18_nad83\palulc_05.tif to new file.

Creating output file that is 5681P x 4602L.

Processing E:\a_new_orgs\carleton\pennsylvania_michaux\land_cover\palulc_05_utm18_nad83\palulc_05.tif [1/1] : 0...10...20...30...40...50...60...70...80...90...100 - done.

Execution completed in 4.94 seconds
Results:
{'OUTPUT': 'C:/Users/User/AppData/Local/Temp/processing_gEEUVX/899b60ac78354e019d9c2a2992ae4905/OUTPUT.tif'}

Loading resulting layers
Algorithm 'Clip raster by mask layer' finished
Land cover clipped for Forest District 17

To filter just the forest values, I referenced https://www.pasda.psu.edu/uci/FullMetadataDisplay.aspx?file=palanduse05utm18nad83.xml which shows values for

41 – Deciduous Forest
42 – Evergreen Forest
43 – Mixed Deciduous and Evergreen

QGIS’ raster calculator is used to the value of raster pixels to 1 if the land cover value is >= 41 and <= 43 (forested) using this formula:

1*("Clipped (mask)@1" >= 41 and "Clipped (mask)@1" <= 43)

Resulting raster with 1 = forested, 0 = not forested.

Sieving out small areas of forest.

For the purposes of this project searching small areas of forest is unlikely to result in RCHs, thus searching these small areas may be a waste of time. To reduce that waste, the small forested areas are sieved from the raster.

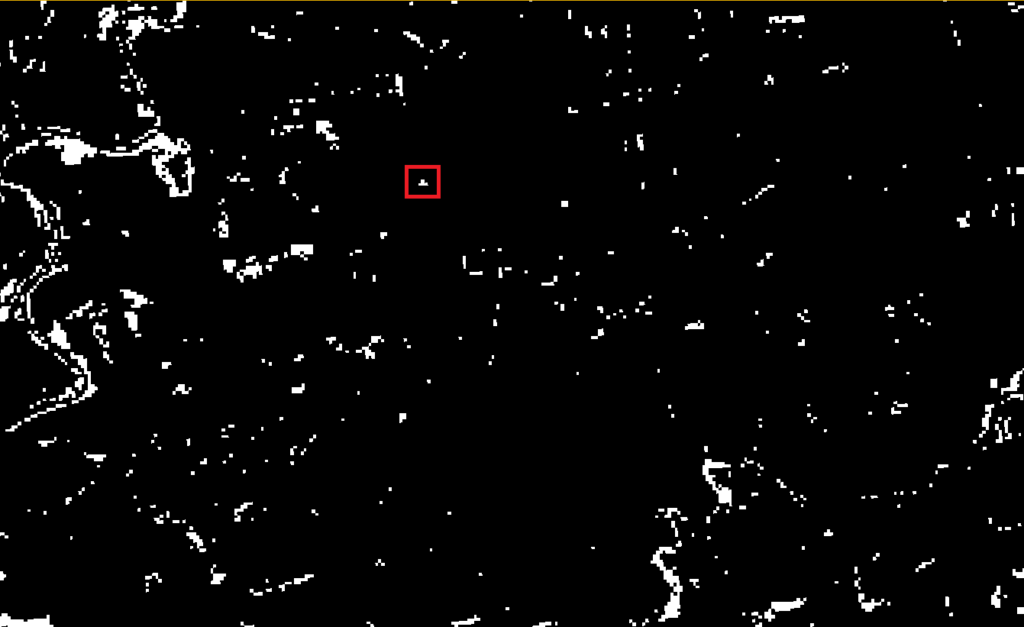
Small forested areas. The forested area in the red box may be too small to have an RCH.

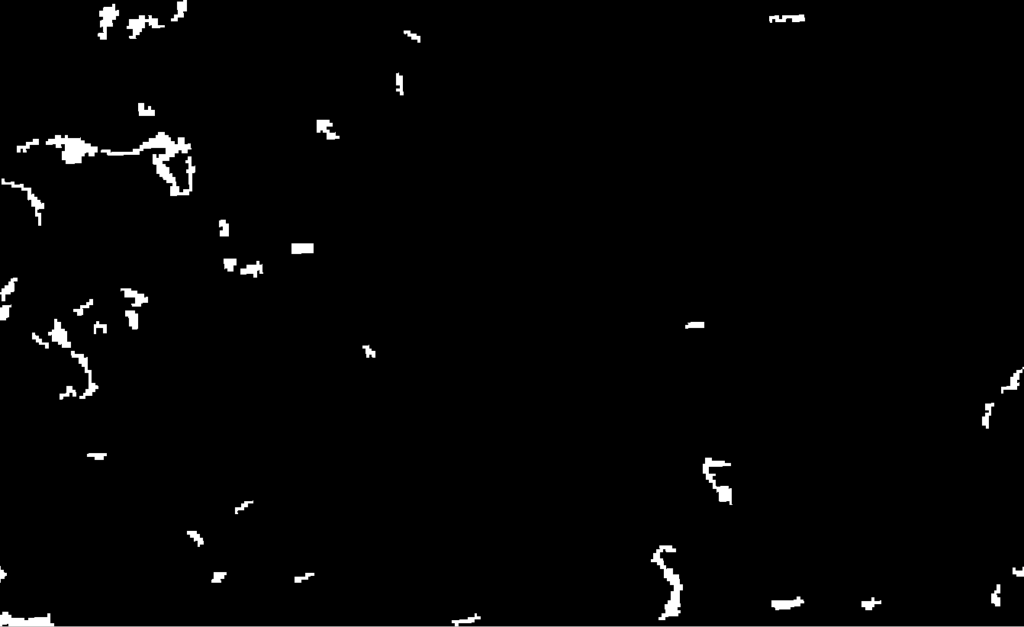
Raster | Analysis |Sieve… Threshold of 9.

Sieved with a threshold of 9 (Did not use 8 connectedness)

This raster has values 1 for forested and 0 for not. I only want to work with the forested data and so I wish to remove the 0 values. To do this in QGIS, right-click on the layer: Export | Save as… and specify 0,0 as No data values.

Raster with 1 values for forest.

Create the vector layer

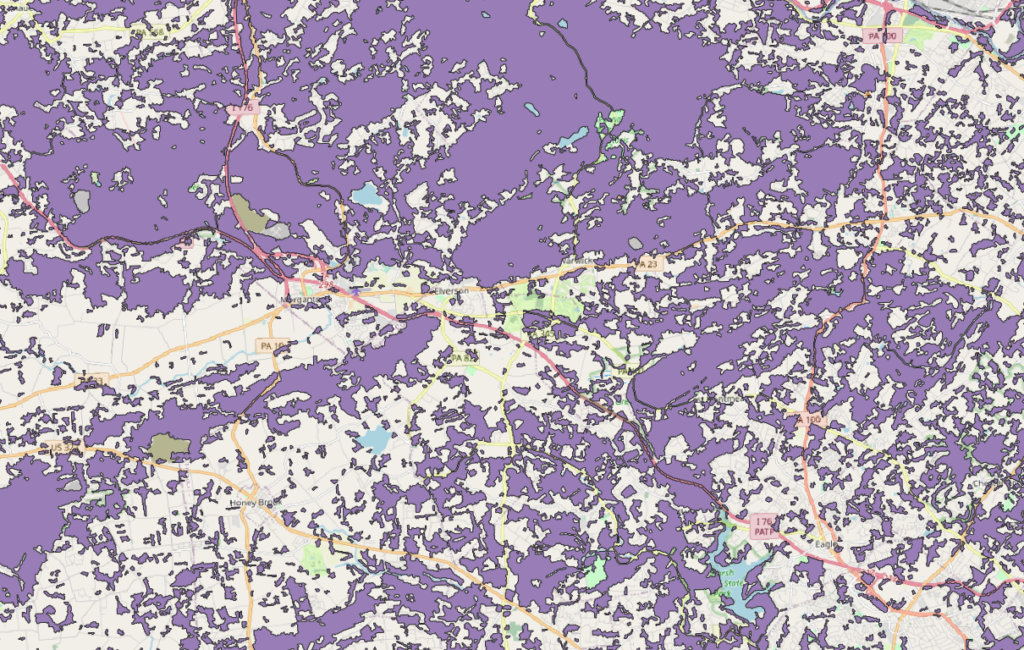
To create the vector layer from a raster in QGIS: Raster | Conversion | Polygonize… Name of field to create: “forested” gdal_polygonize.bat E:\a_new_orgs\carleton\pennsylvania_michaux\land_cover\d17_forest_cover_9july_just_1.tif C:/Users/User/AppData/Local/Temp/processing_exTjDd/2e62017e5fa3420b8dbfff6a5508356f/OUTPUT.gpkg -b 1 -f “GPKG” OUTPUT Forested

The conversion of a raster to vector layer takes a few minutes to process. However when I used the whole raster, before clipping, merging values, sieving and setting 0 = no data, making a vector layer took more than 1 hour and failed.

A sample of part of the vector layer.