Final Project – Start of Journey.

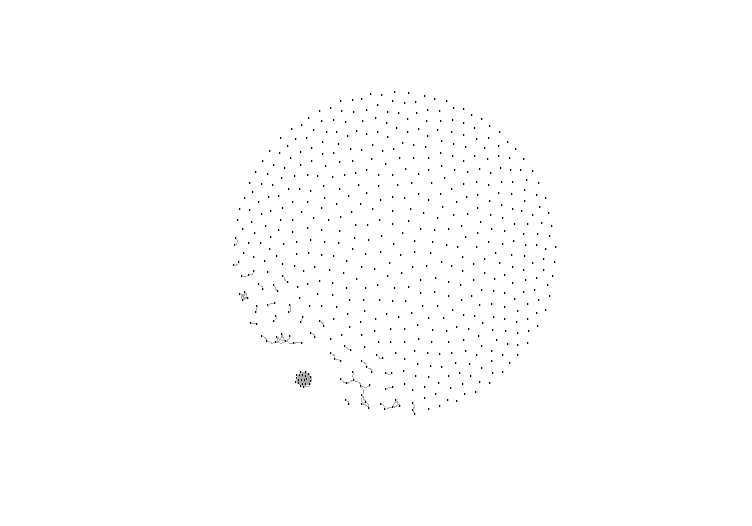
The white-space below is meant to be a picture, a network diagram of topics in the newspaper created using the Fruchterman & Reingold algorithm.  However, there is not much of a visible network.


Even as the image of above represents failure, it also represents the thrill of doing digital history this week.  The final week of the course has truly been thrilling because now I can start to really use what we have been learning and also see even more of its potential. The fail log of this week’s work is here.

The final week is also daunting. It’s been a week of long hours and decisions about when to move on to another part of the project rather than refining.  I had a strong urge to continue to program and experiment, but realized I needed to document my findings in order for this to be a work of history. For presenting my project I decided to use Mahara because it offers more flexibility than a blog, but also looks more polished than a scratch built web site. However, I forgot that Mahara has high PITA factor with multiple mouse-clicks to do things and I reflected that using Markdown would have been more efficient and future proof.

As alluded to above I ran into errors.  I worked on doing a topic model of a collection of editions of the Shawville Equity that contained the results of a provincial election. However, as I ran the program, I ran into an error, shown on the diagram below.

Running the code past the error generated the set of almost totally disconnected dots visualized above.  This was a productive fail because it caused me to consider two things.

The simplest of these was to do with stopwords.  I had a stopwords file, but it was not working.  I examined the documentation for mallet.import and it indicated that it required stopwords be listed on each line, and my stopwords file was separated by commas, with many words on a single line.  I got a new stopwords file and that fixed that issue.

The other item I considered was my collection.  I had thought there would be themes across provincial elections, but an examination of the topics from the model did not support that.  In fact, given that the issues and people running in provincial elections change over the years, there would likely be few common topics spanning more than a decade in provincial election coverage.

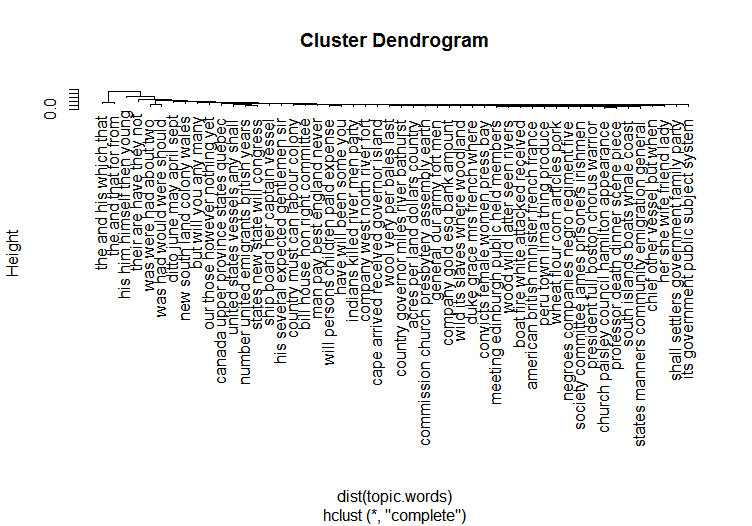
The error and Dr. Graham’s help prompted me to look at my dataset and expand it.  Using all of the text files for the Shawvwille Equity from 1970-1980 caused the program to run without an error.  It also provided a more complex visualization of the topics covered during these eleven years. I want to understand what the ball of topics are at the bottom left of the visualization below.

I also completed work on a finding aid for The Equity by writing an R program. This program lists all of the editions of the Equity and notes which editions were published after specified dates. I started with election dates and want to include other events such as fairs. This program can be adapted for other digitized newspapers archived in a similar manner as the Equity has been.

The repository for this week’s work is here. Learning continues!

Consequences of Digital History

In Mapping Texts: Combining Text-Mining and Geo-Visualization to Unlock the Research Potential of Historical Newspapers, the authors set the context for their ambitious project to develop analytical models to gain historical insight into the content of 232,500 newspaper pages. One of the items they discuss is the abundance of electronic sources for research as “historical records of all kinds are becoming increasingly available in electronic forms.” Historians living in this age of abundance face new challenges, as highlighted by HIST3814o classmate Printhom who asks ”will there be many who cling to the older methods or will historians and academics see the potentially paradigm shifting benefits of technology.”

As pointed out in Mapping Texts, the abundance of sources can overwhelm researchers. In fact, being able to deal with a research project encompassing hundreds of thousands of pages of content also represents a significant financial and technical barrier for researchers. If history is shaped by the people who write it, who will be the people who overcome these barriers to producing digital history and who will be the historians and their communities who will be disenfranchised by a lack of digital access?

Digital Historian Michelle Moravec has been described as someone who “[writes] about marginalized individuals using a marginalized methodology and [publishes] in marginalized places.” Clearly her use of digital history, rather than being a barrier, has been a means to gain a deeper understanding of history, such as her work regarding the relationship of the use of language and the history of women’s suffrage in the United States.

At the same time even with an abundance of available resources, there are also choices made the determine what is available, whether or not an investment will be create a digital source and if there will be a price to access it.

Another consideration is whether the providers of digital history have an agenda beyond history. In her podcast Quantifying Kissinger Micki Kaufman quotes the former U.S. Secretary of State, “everything on paper will be used against me.” Kaufman outlines some of the controversies caused when formerly secret information was made public or, in a humorous case, when publicly available information was republished on Wikileaks. These issues point to the fact that it may be more than just digital historians benefiting from the release of digital sources. Those releasing data may have an agenda to advance, to burnish a reputation or discredit.

Analysing Data: Module 4 of HIST3814o

A finding aid for the Shawville Equity.

This wasn’t an exercise for this week, but I started the week wanting to create a list of the Equity files to make it easier to navigate to follow up annual events.  Last week I was looking at the annual reporting of the Shawville Fair and it took a bit of guess work to pick the right edition of the Equity.  Over time, this led to sore eyes from looking at pdfs I didn’t need to and discomfort in my mouse hand.

To get a list of URLs I used WGET to record all of the directories that hold the Equity files on the BANQ website to my machine, without the files, using the spider option.

wget –spider –force-html -r -w1 -np http://collections.banq.qc.ca:8008/jrn03/equity/

ls -R listed all of the directories and I piped that to a text file.  Using grep to extract only lines containing “collections.banq.qc.ca:8008/jrn03/equity/src/” gave me a list of directories, to which I prepended “http://” to make “http://collections.banq.qc.ca:8008/jrn03/equity/src/1990/05/02/”.  I started editing this list in excel, but realized it would be more educational and, just as importantly, reproducible if I wrote an R script.  I am thinking this R script would note conditions such as:

  • The first edition after the first Sunday of November every 4 years would have municipal election coverage.
  • The annual dates of the Shawville and Quyon fairs.
  • Other significant annual events as found in tools such as Antconc.

That’s not done yet.

Using R.

I am excited by the power of this language and have not used it before. I also liked seeing how well integrated it is with git.  I was able to add my .Rproj file and script in a .R file and push these to GitHub.

The illustrations below come from completing Dr. Shawn Graham’s tutorial on Topic Modelling in R.

Here is a result of using the wordcloud package in R:

Below R produced a diagram to represent words that are shared by topics:

Here is a beautiful representation of links between topics based on their distribution in documents using the cluster and iGraph packages in R:

I can see that the R language and packages offer tremendous flexibility and potential for DH projects.

Exercise 5, Corpus Linguistics with AntConc.

I loaded AntConc locally.  For the corpus, at first, I used all of the text files for the Shawville Equity between 1900-1999 and then searched for occurrences of flq in the corpus. My draft results are here.

When I did a word list, AntConc failed with an error, so I decided to use a smaller corpus of 11 complete years, 1960-1970, roughly the start of the Quiet Revolution until the October Crisis.

Initially, I did not include a stop word list, I wanted to compare the most frequently found word “the” with “le” what appears to be the most frequently found French word.  “The” occurred 322563 times.  “Le” was the 648th most common word in the corpus and was present 1656 times.

The word English occurred 1226 times, while Français occurred 20 times during 1960-1970.

Keyword list in Antconc.

To work with the keyword list tool of AntConc I used text files from the Equity for the complete years 1960-1969 for the corpus. For comparison, I used files from 1990-1999. I used Matthew L. Jockers stopwords list as well. In spite of having a stopwords list, I still had useless keywords such as S and J.

Despite this, it is interesting to me that two words in the top 40 keywords concern religion: rev and church and two other keywords may concern church: service and Sunday. Sunday is the day of the week that is listed first as a keyword. Is this an indicator that Shawville remained a comparatively more religious community than others in Quebec who left their churches in the wake of the Quiet Revolution?

Details of these results are in my fail log.

Exercise 6 Text Analysis with Voyant.

After failing to load a significant amount of text files from the Shawville Equity into Voyant, instead I put them into a zip files and hosted them on my website.  This allowed me to create a corpus in Voyant for the Shawville Equity. I was able to load all of the text files from 1960-1999, but this caused Voyant to produce errors.  I moved to using a smaller corpus of 1970-1980.

Local map in the Shawville Equity.

I tried to find a map of Shawville in the Shawville Equity by doing some text searches with terms like “map of Shawville”, but I did not find anything yet. If you find a map of Shawville in the Equity, please let me know.

Conclusion.

This was an excellent week of learning for me, particularly seeing what R can do.  I would like more time to work with the mapping tools in the future.