Maps use a rich set of symbols and other visual cues to indicate relative importance. Font size is widely used for this. Below are notes continuing from the previous post to filter map content based on the size of lettering.
In this map, settlement names and geographic points of interest are labelled with large letters, shown in red, while property owner names are in a smaller font.

The rectangles above come from coordinates provided by Azure Cognitive Services when it transcribes text. They provide a good approximation of the size of the text. A rough font size is calculated using the length of the rectangle divided by the number of letters in contains. The code is below.
import math
# Get the operation location (URL with an ID at the end) from the response
operation_location_remote = recognize_handw_results.headers["Operation-Location"]
# Grab the ID from the URL
operation_id = operation_location_remote.split("/")[-1]

# Call the "GET" API and wait for it to retrieve the results
while True:
    get_handw_text_results = computervision_client.get_read_result(operation_id)
    if get_handw_text_results.status not in ['notStarted', 'running']:
        break
    time.sleep(1)

# Print the detected text, line by line
# reads results returned by Azure Congitive Services
# puts results into the list "lines_of_text" to use later
lines_of_text = []
if get_handw_text_results.status == OperationStatusCodes.succeeded:
    for text_result in get_handw_text_results.analyze_result.read_results:
        for line in text_result.lines:
            line_data = []
            print(line.text)
            line_data.append(line.text)
            #print(line.bounding_box)
            line_data.append(line.bounding_box)
            pts = line_data[1]
            # Calculate the distance between the x points (x2 - x1)
            xd = abs(pts[4] - pts[0])
            # Calculate the distance between the y points (y2 - y1)
            yd = abs(pts[5] - pts[1])
            # calculate the length of the rectangle containing the words
            word_length = math.sqrt((xd ** 2) + (yd ** 2))

            letter_length = round(word_length/len(line.text)) # This is the rough font size
            print(letter_length)
            line_data.append(letter_length)
            lines_of_text.append(line_data)
With this calculation, here are some sample font sizes:
| Text | Approximate font size |
| SCHOOL | 24 |
| DIST | 19 |
| E. Wamsher | 12 |
| .Z. Miller | 8 |
Setting a font size cut-off of 15 filters the content we want to keep from the larger font content:
for l in lines_of_text:
    pts = l[1]
    letter_size = l[2]

    fColor = fontColor
    if(letter_size < 15):

        # add text
        cv2.putText(img, l[0], (int(pts[0]),int(pts[1])),  font,  fontScale,  fColor, lineType)
        # add rectangle
        cv2.rectangle(img,(int(pts[0]),int(pts[1])),(int(pts[4]),int(pts[5])),fColor,1)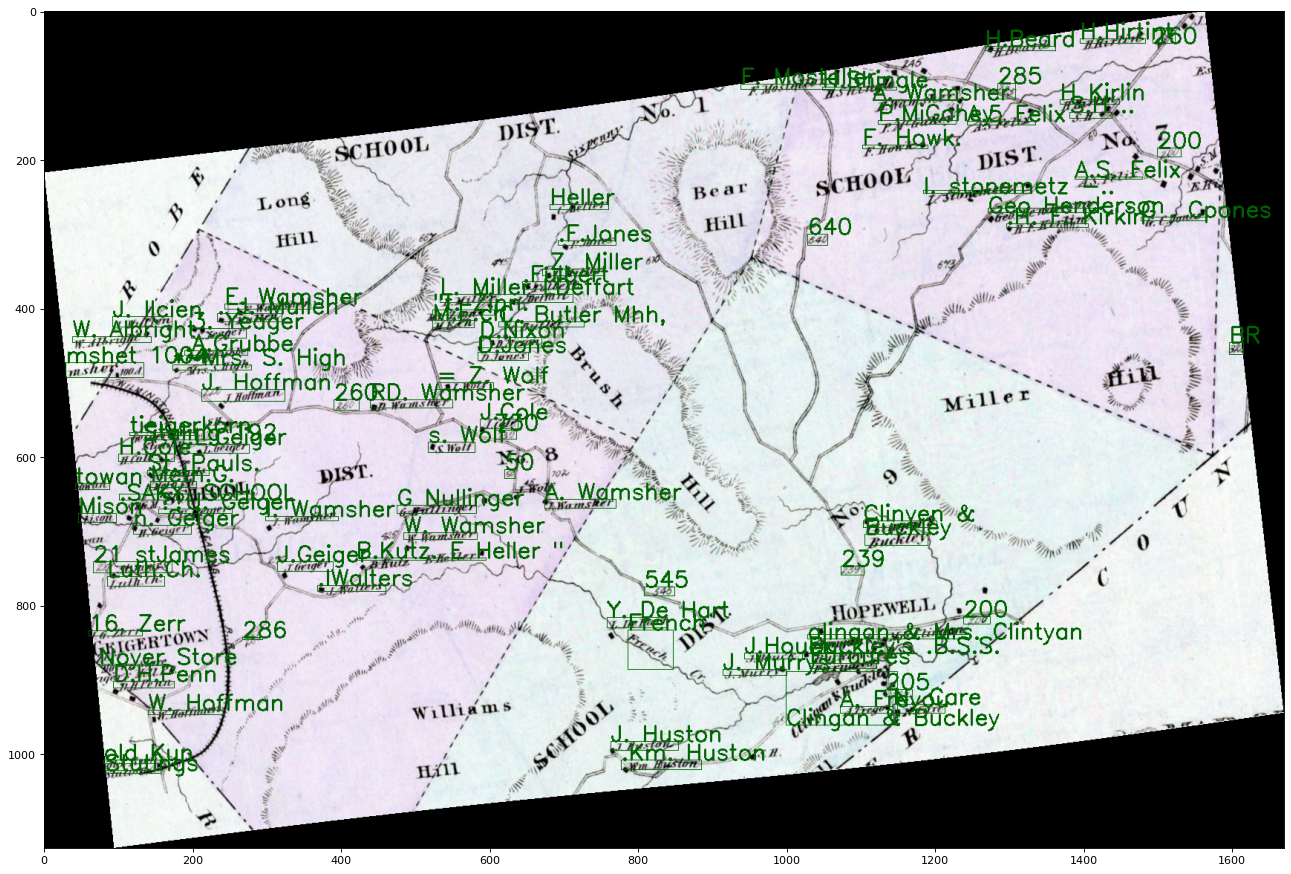
A copy of the program is here.