This week I have continued work with the National Library of Wales’ Welsh Newspapers Online. Working with this collection I wanted to see if there was a significant pattern with the number of newspaper stories found in search results for my research on allotment gardening in Wales during World War I. I used this R program to search Welsh Newspapers Online and store the results in a MySQL database. My previous post here explains how the web page parsing in program works.
Below is a graph of the number of newspaper stories containing the words “allotment” and “garden” published each month during World War I:
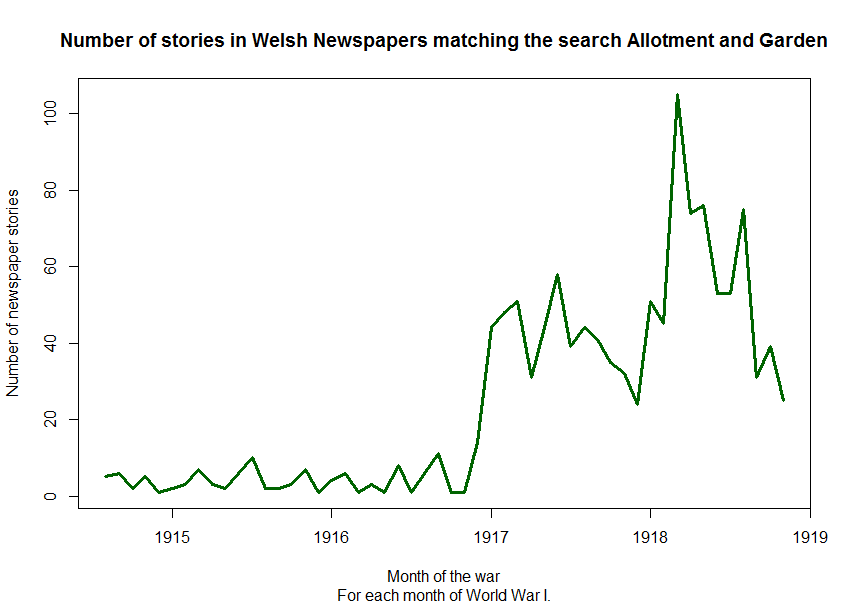
The number of newspaper stories in Welsh papers containing allotment and garden rises significantly in 1917 after a poor harvest in 1916 and the establishment of the British Ministry of Food on 22 December, 1916 [1].
Below is the R program used to make the graph. Initially I had problems graphing the data for each month. If I just used numbers for the months where August 1914 was month 1 and November 1918 was month 52 the graph was harder to interpret. Using a time series helped, see this line in the program below: qts1 = ts(dbRows$count, frequency = 12, start = c(1914, 8)).
library(RMySQL)
rmysql.settingsfile<-"C:\\ProgramData\\MySQL\\MySQL Server 5.7\\newspaper_search_results.cnf"

rmysql.db<-"newspaper_search_results"
storiesDb<-dbConnect(RMySQL::MySQL(),default.file=rmysql.settingsfile,group=rmysql.db)

searchTermUsed="AllotmentAndGarden"
query<-paste("SELECT (concat('1 ',month(story_date_published),' ',year(story_date_published))) as 'month',count(concat(month(story_date_published),' ',year(story_date_published))) as 'count' from tbl_newspaper_search_results WHERE search_term_used='",searchTermUsed,"' GROUP BY year(story_date_published),month(story_date_published) ORDER BY year(story_date_published),month(story_date_published);",sep="")
print(query)
rs = dbSendQuery(storiesDb,query)
dbRows<-dbFetch(rs)
dbRows$month = as.Date(dbRows$month,"%d %m %Y")
qts1 = ts(dbRows$count, frequency = 12, start = c(1914, 8))
plot(qts1, lwd=3,col = "darkgreen", xlab="Month of the war",ylab="Number of newspaper stories", main=paste("Number of stories in Welsh Newspapers matching the search Allotment and Garden",sep=""),sub="For each month of World War I.")

dbDisconnect(storiesDb)
It appears that a lot of stories were published about allotment gardening in the last two years of World War I in Wales. Were these stories published in newspapers throughout Wales or only in some areas? To answer this question we need to know the location of each newspaper that published a story and relate that to the stories published in the database.
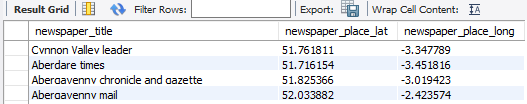
I referenced a list of all the Welsh newspapers available on-line. Each newspaper also has a page of metadata about it. To gather data, I used an R program to parse the list of newspapers and lookup each newspaper’s metadata. This program extracted the name of the place the newspaper was published and stored that into a database.
Below is the detail of the geocoding and inserting of values into the database. I removed a tryCatch() handler for the geocode statement for readability.
NewspaperDataPlaceGeoCode= geocode(paste(NewspaperDataPlace,",",NewspaperDataCountry,sep=""))

 NewspaperDataPlaceLat = NewspaperDataPlaceGeoCode[[2]]
 NewspaperDataPlaceLong = NewspaperDataPlaceGeoCode[[1]]


query<-paste("INSERT INTO `newspaper_search_results`.`tbl_newspapers`(`newspaper_id`,`newspaper_title`,`newspaper_subtitle`,`newspaper_place`,`newspaper_country`,`newspaper_place_lat`,`newspaper_place_long`) VALUES ('",newspaperNumber,"','",sqlInsertValueClean(NewspaperDataTitle),"',LEFT(RTRIM('",sqlInsertValueClean(NewspaperDataSubTitle),"'),255),'",NewspaperDataPlace,"','",NewspaperDataCountry,"',",NewspaperDataPlaceLat,",",NewspaperDataPlaceLong,");",sep="")
I used R’s ggmap to plot the locations of the newspapers on a map of Wales.[2] Below, the title, latitude and longitude is selected from tbl_newspapers and then put into the dataframe named df.
query="SELECT `newspaper_title`,`newspaper_place_lat`,`newspaper_place_long` FROM `tbl_newspapers`;"
rs = dbSendQuery(newspapersDb,query)
dbRows<-dbFetch(rs)

df <- data.frame(x=dbRows$newspaper_place_long, y=dbRows$newspaper_place_lat,newspaperTitle=dbRows$newspaper_title)

#opens a map of Wales
mapWales <- get_map(location = c(lon = -4.08292, lat = 52.4153),color = "color",source = "google",maptype = "roadmap",zoom = 8)

ggmap(mapWales, base_layer = ggplot(aes(x = x, y = y, size = 3), data = df)) + geom_point(color="blue", alpha=0.3)
dbDisconnect(newspapersDb)
Ggmap plots the locations of the newspapers in the df dataframe on to the mapWales map:
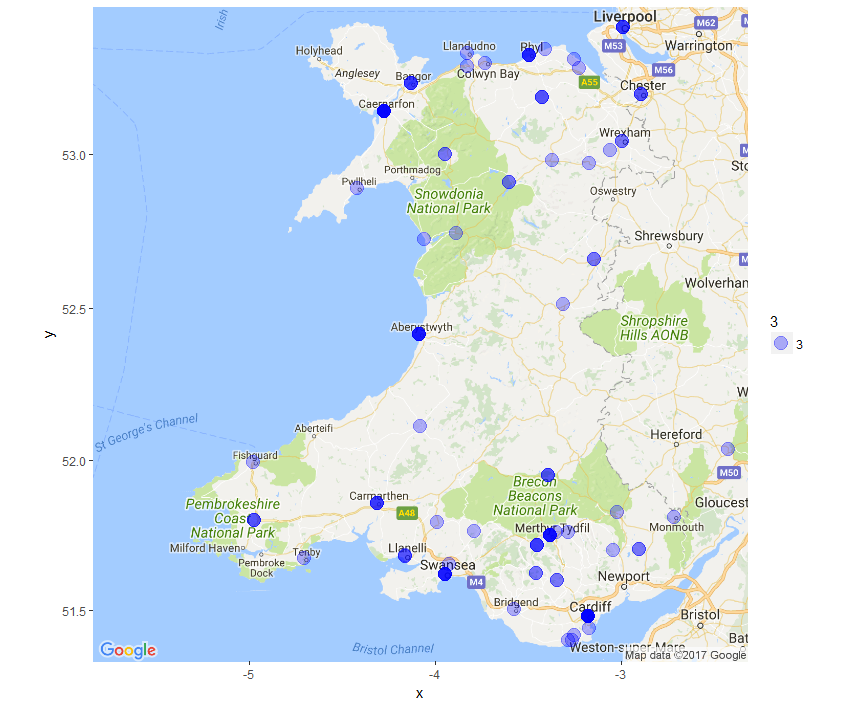
The map above shows the locations where each newspaper in the Welsh National Library collection was published. To make this usable with the collection of stories about allotment gardens that were printed during World War I, I will change the program to join the table of stories to the table of newspaper locations and plot only the locations of the newspapers that printed the stories in the collection of search results above.
To improve on this, instead of just plotting the publication location, I would like to plot the area the newspaper circulated in. I plan to see if I can reliably get this information from the newspaper metadata.
Thanks to Jiayi (Jason) Liu for the article Ggmap. See: https://rpubs.com/jiayiliu/ggmap_examples
[1] Records of the Ministry of Food. British National Archives.
[2] D. Kahle and H. Wickham. ggmap: Spatial Visualization with ggplot2. The R Journal, 5(1), 144-161. URL http://journal.r-project.org/archive/2013-1/kahle-wickham.pdf