LiDAR captures details of the Earth’s surface and LAS files contain these data in 3 dimensional points of x, y and z coordinates. I want to take these data and use them to model some of the objects LiDAR detects.
I’m using Python’s laspy library, documented here and installed per below.
!pip install laspyLaspy works with LAS files. The file I’m working with is from Pennsylvania and this type of data is available for a wide number of geographies. Here’s a list of LiDAR sources for Canadian provinces.
Open the file:
import numpy as np
from laspy.file import File
inFile = File("/content/drive/My Drive/MaskCNNhearths/code_and_working_data/test_las/24002550PAN.las", mode = "r")
From the laspy tutorial, here is a list of fields in the LAS file.
# Code from the laspy tutorial https://pythonhosted.org/laspy/tut_part_1.html
# Find out what the point format looks like.
pointformat = inFile.point_format
for spec in inFile.point_format:
    print(spec.name)

print("------------")

header = inFile.header

print(header.file_signature)
print(header.file_source_id)
print(header.global_encoding)
print(header.guid)
print(header.max)
print(header.offset)
print(header.project_id)
print(header.scale)
print(header.schema)

print("------------")

#Lets take a look at the header also.
headerformat = inFile.header.header_format
header = inFile.header
for spec in headerformat:
    print(spec.name)
Initially when I looked at plotting data in LAS files, I saw results that didn’t resemble the landscape, like below:
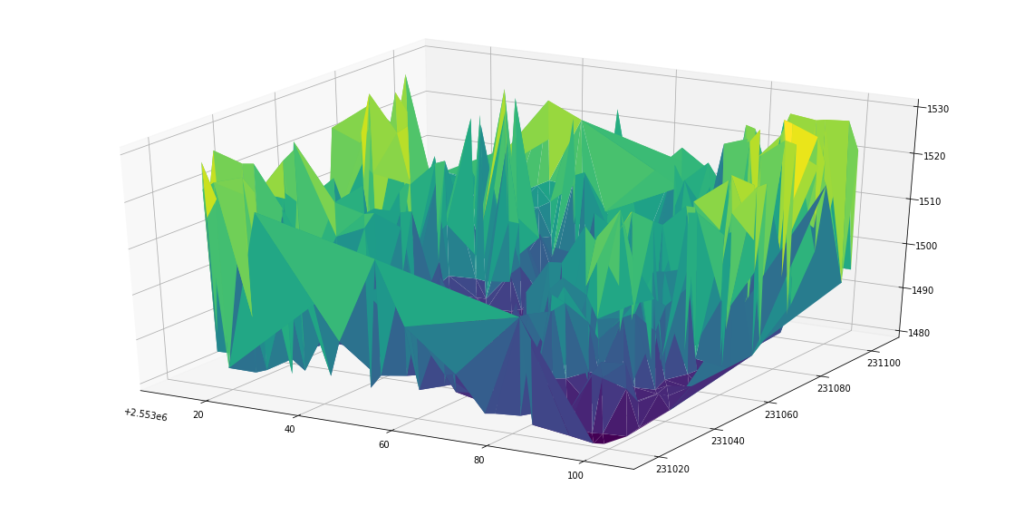
The points have a raw_classification (see below). Sorting for points where raw_classification = 2 provides a closer representation of the surface.
%matplotlib inline
import matplotlib.pyplot as plt
plt.hist(inFile.raw_classification)
plt.title("Histogram of raw_classification")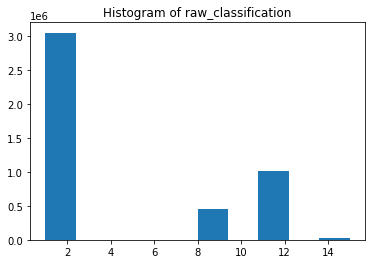
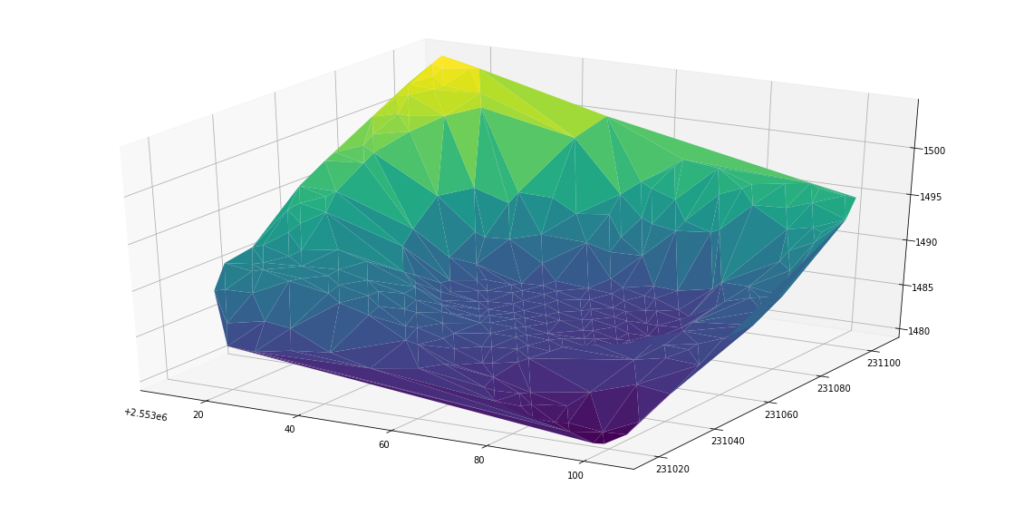
Below, the points in the LAS file are reduced to those that are just raw_classification = 2 and are within coordinates (2553012.1, 231104.9) and
(2553103.6,231017.5).
#https://jakevdp.github.io/PythonDataScienceHandbook/04.12-three-dimensional-plotting.html
from mpl_toolkits import mplot3d
%matplotlib inline
import numpy as np
import matplotlib.pyplot as plt

# Data for three-dimensional scattered points
ax = plt.axes(projection='3d')
coords = np.vstack((inFile.x, inFile.y, inFile.z, inFile.raw_classification)).transpose()

#2553012.1,231104.9
#2553103.6,231017.5

#2556834.3,230831.6
#2556985.1,230582.2
x1,y1 = 2553012.1,231104.9
x2,y2 = 2553103.6,231017.5

# raw_classification = 2
keep = coords[:,3]==2
keep_points = keep == True
coords = coords[keep_points]

keep = coords[:,0] > x1
keep_points = keep == True
coords = coords[keep_points]

keep = coords[:,0] < x2
keep_points = keep == True
coords = coords[keep_points]

keep = coords[:,1] > y2
keep_points = keep == True
coords = coords[keep_points]

keep = coords[:,1] < y1
keep_points = keep == True
coords = coords[keep_points]

print("We're keeping %i points out of %i total"%(len(coords), len(inFile)))

zdata = coords[:,2]
xdata = coords[:,0]
ydata = coords[:,1]
ax.scatter3D(xdata, ydata, zdata, c=zdata, cmap='Greens');
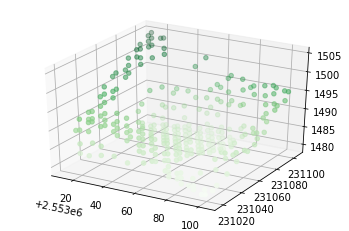
fig = plt.figure(figsize=(20,10))
ax = plt.axes(projection='3d')

ax.plot_trisurf(xdata, ydata, zdata,
                cmap='viridis', edgecolor='none');