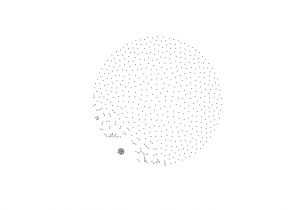
The white-space below is meant to be a picture, a network diagram of topics in the newspaper created using the Fruchterman & Reingold algorithm. However, there is not much of a visible network.
Even as the image of above represents failure, it also represents the thrill of doing digital history this week. The final week of the course has truly been thrilling because now I can start to really use what we have been learning and also see even more of its potential. The fail log of this week’s work is here.
The final week is also daunting. It’s been a week of long hours and decisions about when to move on to another part of the project rather than refining. I had a strong urge to continue to program and experiment, but realized I needed to document my findings in order for this to be a work of history. For presenting my project I decided to use Mahara because it offers more flexibility than a blog, but also looks more polished than a scratch built web site. However, I forgot that Mahara has high PITA factor with multiple mouse-clicks to do things and I reflected that using Markdown would have been more efficient and future proof.
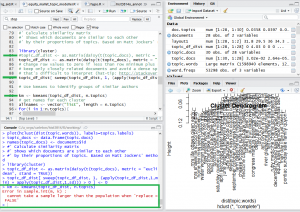
As alluded to above I ran into errors. I worked on doing a topic model of a collection of editions of the Shawville Equity that contained the results of a provincial election. However, as I ran the program, I ran into an error, shown on the diagram below.
Running the code past the error generated the set of almost totally disconnected dots visualized above. This was a productive fail because it caused me to consider two things.
The simplest of these was to do with stopwords. I had a stopwords file, but it was not working. I examined the documentation for mallet.import and it indicated that it required stopwords be listed on each line, and my stopwords file was separated by commas, with many words on a single line. I got a new stopwords file and that fixed that issue.
The other item I considered was my collection. I had thought there would be themes across provincial elections, but an examination of the topics from the model did not support that. In fact, given that the issues and people running in provincial elections change over the years, there would likely be few common topics spanning more than a decade in provincial election coverage.
The error and Dr. Graham’s help prompted me to look at my dataset and expand it. Using all of the text files for the Shawvwille Equity from 1970-1980 caused the program to run without an error. It also provided a more complex visualization of the topics covered during these eleven years. I want to understand what the ball of topics are at the bottom left of the visualization below.
I also completed work on a finding aid for The Equity by writing an R program. This program lists all of the editions of the Equity and notes which editions were published after specified dates. I started with election dates and want to include other events such as fairs. This program can be adapted for other digitized newspapers archived in a similar manner as the Equity has been.
The repository for this week’s work is here. Learning continues!


Hi Jeff- what a cool little finding aid; I’ve learned a lot from this! Re municipal elections, maybe this will be of help: https://en.wikipedia.org/wiki/Category:Municipal_elections_in_Quebec
Mind if I share your post on Twitter?
Thanks Dr. Graham for sharing this on Twitter,
Jeff