Recently for work I wanted to present information that was in an Excel file using Powerpoint. The data in the Excel file has ongoing edits and I wanted a way to make it easier to keep the Powerpoint presentation synched with what is in Excel. I didn’t want to copy and paste or edit in two places.
For this example, I’m using a spreadsheet of types of trees. Thanks to the former City of Ottawa Forests and Greenspace Advisory Committee for compiling this data.
Excel spreadsheets can be read by Python’s Pandas into a dataframe:
import pandas as pd
spreadsheet_path = "/content/trees.xls"
trees_df = pd.read_excel(open(spreadsheet_path , 'rb'),  header=0)
I wanted to take the dataframe and make a set of slides from it. Python-pptx creates Powerpoint files quite nicely. I installed it with: !pip install python-pptx
I created a class so that I could call python-pptx methods. The class would handle creating slides with tables, as per below. The full notebook is in Github.
from pptx import Presentation
from pptx.util import Inches, Pt
import pandas as pd

class Ppt_presentation:

    # class attribute
    # Creating presentation object
    ppt_presentation = Presentation()

    # instance attribute
    def __init__(self):
        self.ppt_presentation = Presentation()

    def get_ppt_presentation(self):
        return self.ppt_presentation

    # Adds one slide with text on it
    def add_slide_text(self, title_text, body_text):
        # Adding a blank slide in out ppt
        slide = self.ppt_presentation.slides.add_slide(self.ppt_presentation.slide_layouts[1])
        slide.shapes.title.text = title_text
        slide.shapes.title.text_frame.paragraphs[0].font.size = Pt(32)
        # Adjusting the width !
        x, y, cx, cy = Inches(.5), Inches(1.5), Inches(8.5), Inches(.5)
        shapes = slide.shapes
        body_shape = shapes.placeholders[1]
        tf = body_shape.text_frame
        tf.text = body_text

    # Adds one slide with a table on it.  The content of the table is a Pandas dataframe
    def add_slide_table_df(self, df, title_text, col_widths):
        # Adding a blank slide in out ppt
        slide = self.ppt_presentation.slides.add_slide(self.ppt_presentation.slide_layouts[5])
        slide.shapes.title.text = title_text
        slide.shapes.title.text_frame.paragraphs[0].font.size = Pt(32)
        # Adjusting the width !
        x, y, cx, cy = Inches(.5), Inches(1.5), Inches(8.5), Inches(.5)
        df_rows = df.shape[0]
        df_cols = df.shape[1]

        # Adding tables
        table = slide.shapes.add_table(df_rows+1, df_cols, x, y, cx, cy).table
        ccol = table.columns


        for c in range(0,df_cols):
            table.cell(0, c).text = df.columns.values[c]
            ccol[c].width = Inches(col_widths[c])

        for r in range(0,df_rows):
            for c in range(0,df_cols):
                table.cell(r+1, c).text = str(df.iat[r,c])
                for p in range(0,len(table.cell(r+1, c).text_frame.paragraphs)):
                    table.cell(r+1, c).text_frame.paragraphs[p].font.size = Pt(12)

    # Adds a series of slides with tables.  The content of the tables is a Pandas dataframe.
    # This calls add_slide_table_df to add each slide.
    def add_slides_table_df(self, df, rows, title_text, col_widths):
        df_rows = df.shape[0]
        if(rows > df_rows):
            self.add_slide_table_df(df, title_text, col_widths)
            return
        else:
            for df_rows_cn in range(0, df_rows, rows):
                print(df_rows_cn)
                rows_df_end = df_rows_cn + rows
                if rows_df_end > df_rows:
                    rows_df_end = df_rows
                rows_df = df.iloc[df_rows_cn:rows_df_end,:]
                self.add_slide_table_df(rows_df, title_text, col_widths)
            return

    def save(self,filename):
        self.ppt_presentation.save(filename)
Below a title slide is created.
# import Presentation class
# from pptx library
from pptx import Presentation
from pptx.util import Inches, Pt
import pandas as pd

ppres = Ppt_presentation()
ppres.add_slide_text("Salt Tolerance of Trees","November, 2020")
ppres.save("presentation.pptx")
print("done")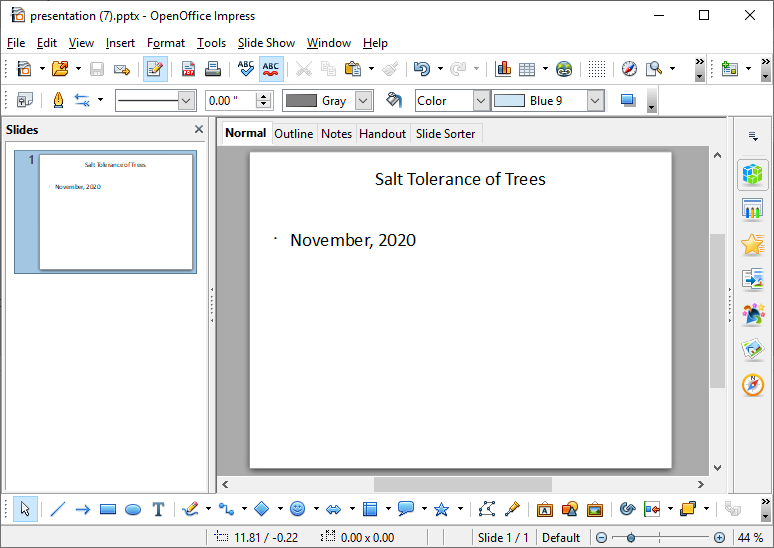
Next, I would like a set of slides with tables showing the common name of each type of tree, its botanical name and its salt tolerance. The data is read from Excel .xls into a dataframe.
trees_df = pd.read_excel(open(spreadsheet_path , ‘rb’), header=0)
The rows and columns to be presented in the table are selected from the dataframe:
# Specify the rows and columns from the spreadsheet
cols_df = trees_df.iloc[0:132,[1,3,16]]
The column widths of the table in Powerpoint are set:
col_widths = [1.5,3.5,3.5]
The add_slides_table_df method of Ppt_presentation class is called:
ppres.add_slides_table_df(cols_df, 15, “Trees: Common name, Latin Name, Salt Tolerance.”,col_widths)
# import Presentation class
# from pptx library
from pptx import Presentation
from pptx.util import Inches, Pt
import pandas as pd

ppres = Ppt_presentation()
ppres.add_slide_text("Salt Tolerance of Trees","November, 2020")

spreadsheet_path = "/content/trees.xls"

trees_df = pd.read_excel(open(spreadsheet_path , 'rb'),  header=0)
# We have some missing values. These need to be fixed, but for purposes today, replace with -
trees_df = trees_df.fillna("-")

# Specify the rows and columns from the spreadsheet
cols_df = trees_df.iloc[0:132,[1,3,16]]

# Add slides with tables of 8 rows from the dataframe
# Specify the column widths of the table in inches
col_widths = [1.5,3.5,3.5]
ppres.add_slides_table_df(cols_df, 15, "Trees: Common name, Latin Name, Salt Tolerance.",col_widths)

ppres.save("presentation.pptx")
print("done")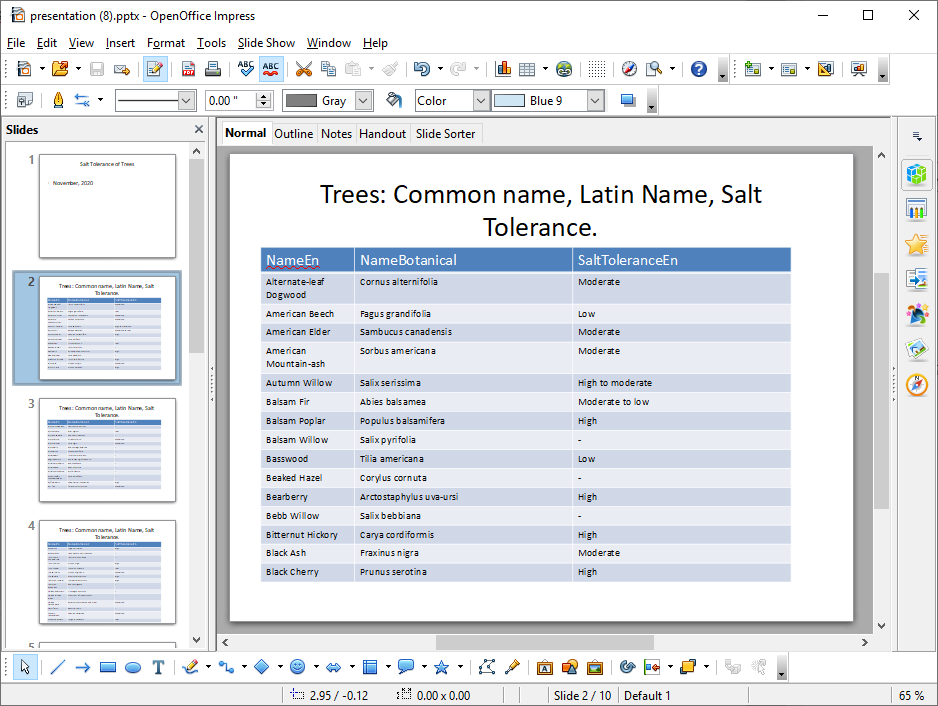
Slides grouping trees by their salt tolerance is useful when considering trees for a particular site. The dataframe is sorted and grouped per below:
# Group results in dataframe by unique value
# Sort values for second column
salt_tolerance_df = trees_df.sort_values([‘SaltToleranceEn’,’NameBotanical’])
salt_tolerance_df = salt_tolerance_df.groupby([‘SaltToleranceEn’])[‘NameBotanical’].apply(‘, ‘.join).reset_index()
# import Presentation class
# from pptx library
from pptx import Presentation
from pptx.util import Inches, Pt
import pandas as pd

ppres = Ppt_presentation()
ppres.add_slide_text("Salt Tolerance of Trees","November, 2020")

spreadsheet_path = "/content/trees.xls"

trees_df = pd.read_excel(open(spreadsheet_path , 'rb'),  header=0)
#We have some missing values. These need to be fixed, but for purposes today, replace with -
trees_df = trees_df.fillna("-")

# Specify the rows and columns from the spreadsheet
cols_df = trees_df.iloc[0:132,[1,3,16]]

# Group results in dataframe by unique value
# Sort values for second column
salt_tolerance_df = trees_df.sort_values(['SaltToleranceEn','NameBotanical'])
salt_tolerance_df = salt_tolerance_df.groupby(['SaltToleranceEn'])['NameBotanical'].apply(', '.join).reset_index()

#Add slides with tables of 2 rows from the dataframe
col_widths = [1.5,7]
ppres.add_slides_table_df(salt_tolerance_df, 2, "Salt Tolerance",col_widths)

ppres.save("presentation.pptx")
print("done")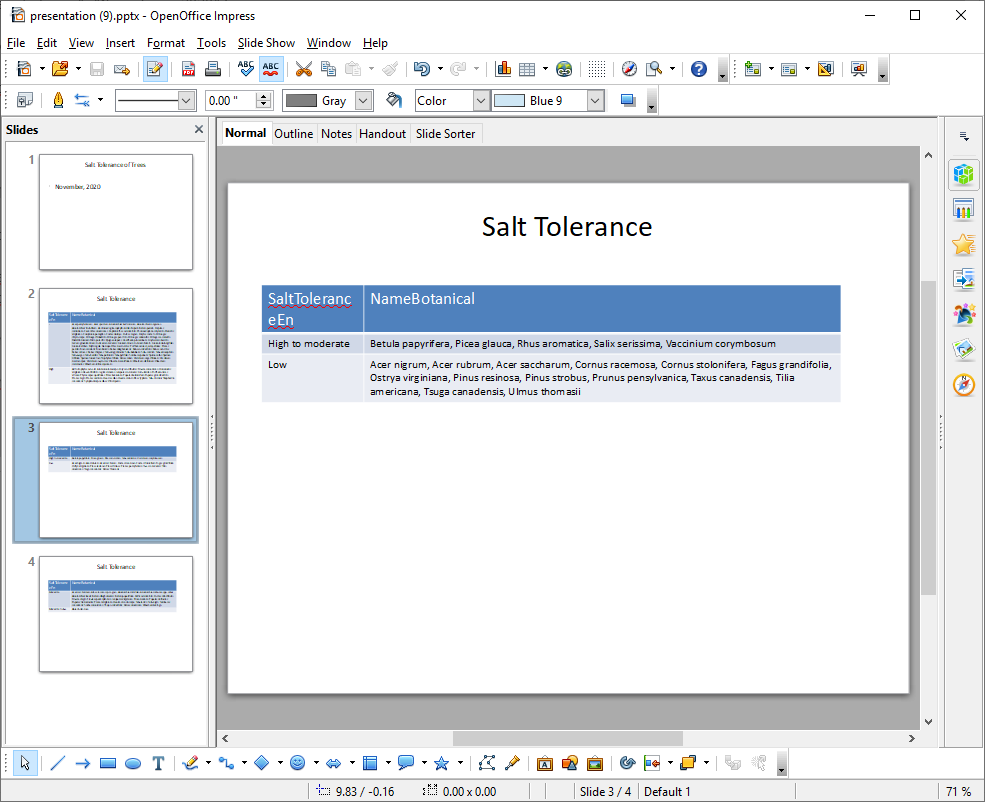
These slides are simple and need more formatting, but that can be done with Python-pptx too.